I've been building up an internal database of market-related data by scraping various sources of the internet lately, with the goal of building something useful I can use as a starting point for model development. Some of this data includes:
- Minute level OHLC prices for many equities (in the S&P 500), some ETFs, commodities
- IB Contract metadata
- Reddit comments and submissions
Naturally, all of this exists mainly as a starting point for an eventual data-rich playground revolving around the markets. What I've wanted to explore lately is the correlation of various assets, in relation to each other and in relation to the broader world scope.
This is a visualization I did up for fun: price movement of various assets from 2017 to 2020, with each period's top 0.1 percentile of Reddit submissions highlighted. The goal of this is twofold: One, to watch relative movements of common asset classes, and two, to see if commonly commented-on Reddit threads have any forward-looking significance for price movement. Reddit threads have two purposes: To serve as a reflection of public sentiment (much closer to dumb money than smart money), and to reflect significant news articles (as these often receive huge numbers of comments).
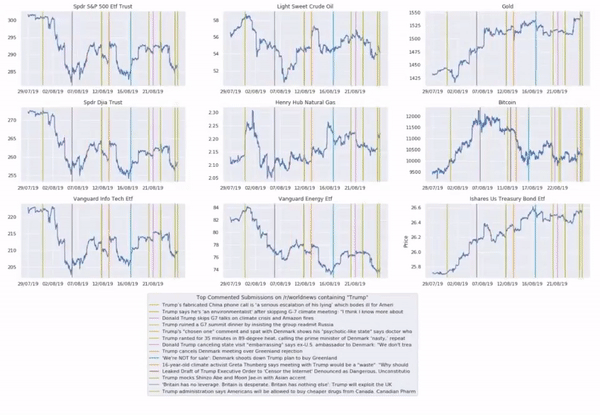
This serves more as an EDA than a quantitative analysis - but does well enough in that it gets across the nature of the data (one minute OHLCs and forum posts) along with potential relations between the two. Over the next sections I'll cover some interesting things I noted, covering correlations of phenomena with significant decision makers in the markets.
The Coronavirus and the Federal Reserve
The latest pandemic has wreaked havoc on the markets, and I thought it would be a nice opportunity to monitor how influential the Federal Reserve has been in the markets. To that end, I did a few visualizations on this.
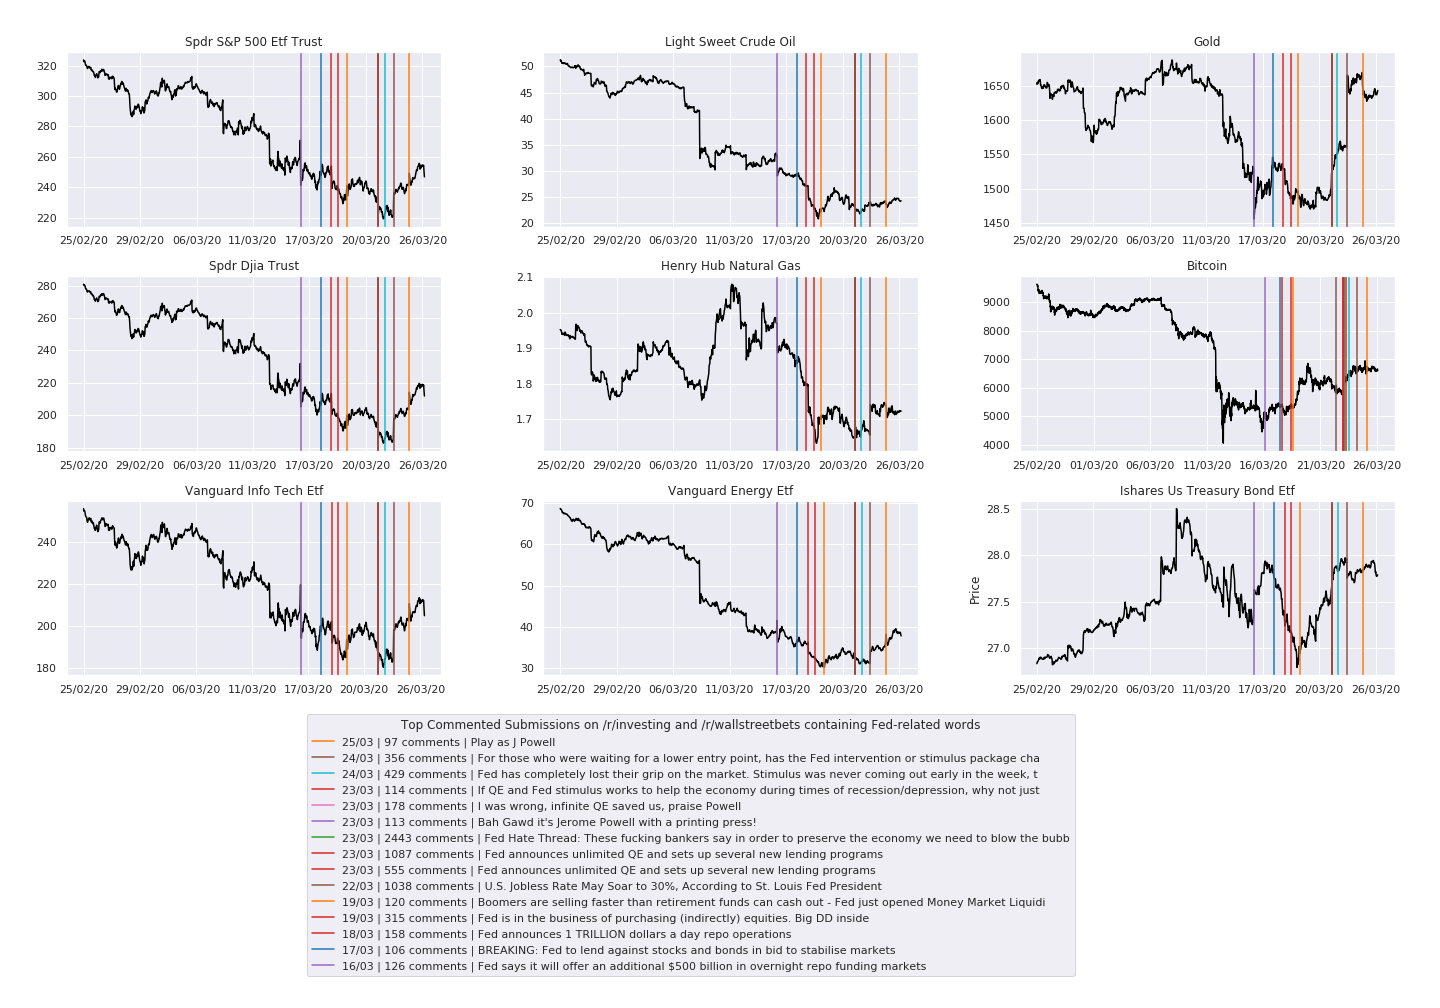
Part One: the Fall
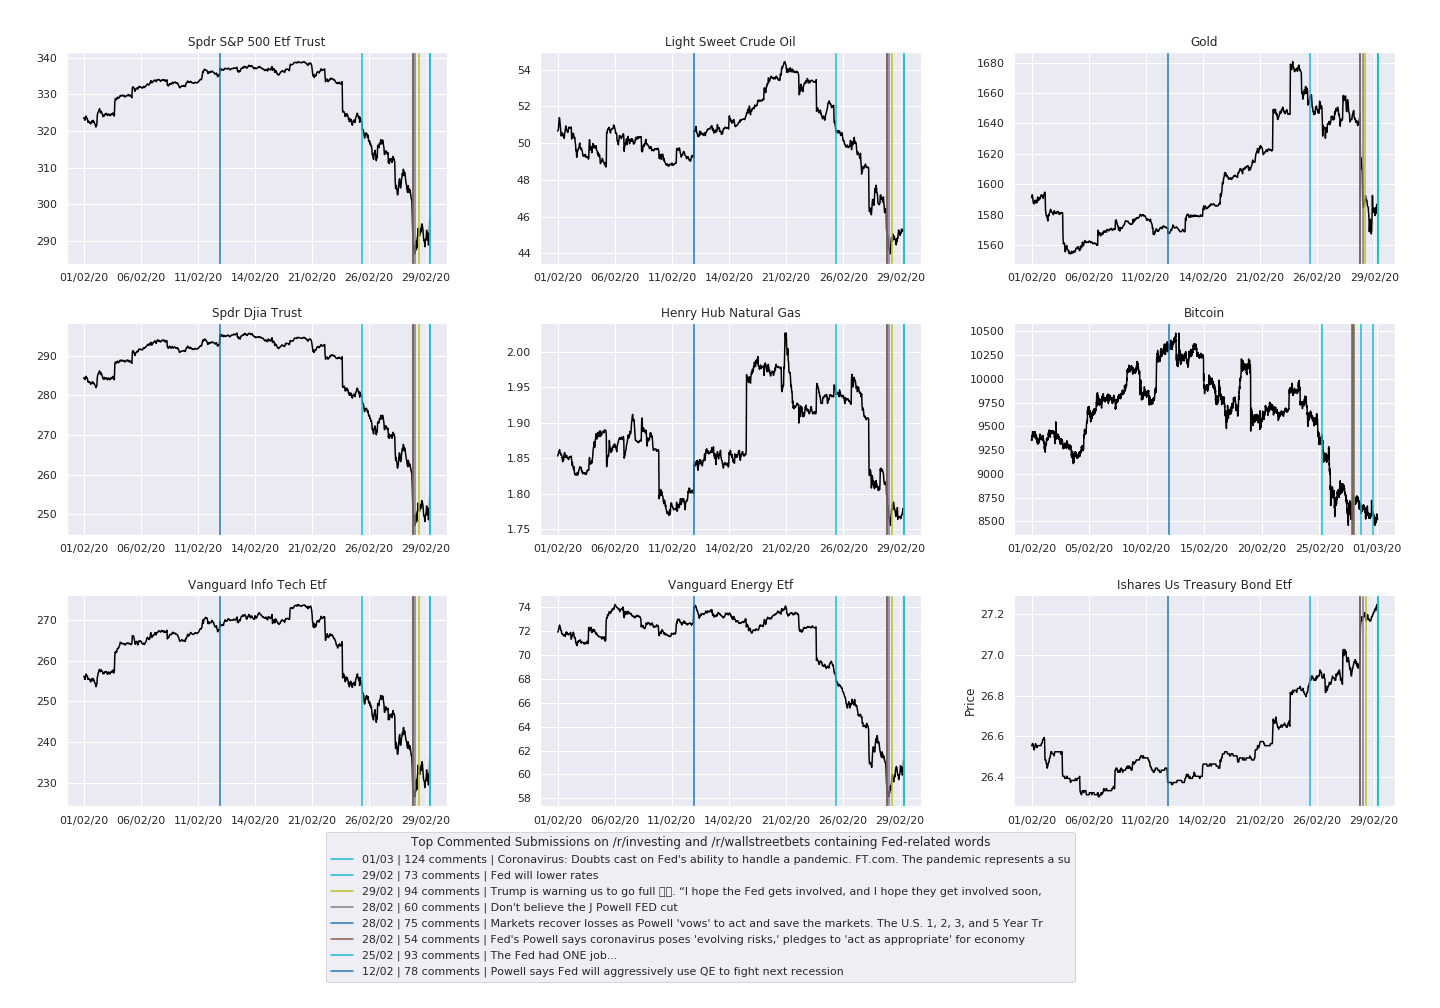
The Covid-19 coronavirus became a significant issue in American markets around the 22nd of February, though from Singapore's perspective it had already gained prominence in the public mind by mid-January (MOH past updates). In mid-February, a submission gained prominence with the title "Powell says Fed will aggressively use QE to fight next recession", prompting a slight rise in the markets, and indicating some awareness of potential troubles brewing. The SPY was still in the $335 range back then. Between then and late February, we see a massive plummet in the markets, with multiple days of the SPY hitting limit-down circuit-breakers.
Following that we get a plethora of Fed-related submissions. Several points of note in this 25/02 to 29/02 band:
- The Fed actively attempts to provide stability in the market. Multiple posts on 28th of February regarding Powell's pledges to "act as appropriate", along with public pressure from Trump on the Federal reserve on the 29th.
- US Treasuries moving inversely with the S&P during this time, pricing in rate cuts (which still stood at 1.58 at that the time ycharts) as the markets shuddered
- Energy and Infotech ETFs moving similarly with the SPX, indicating price movements are on a macro-scale; entities investing in a generalized nature (index funds, etc.) closing positions on US markets as a whole.
- Curiously, gold plummets from 1640 to 1580, on the 28th of February. Later people referred to this phenomenon as a 'liquidity crunch' - players invested across multiple asset classes had to close positions in Gold in order to cover positions in equities, for example.
- The Fed cuts interest rates on the 29th to 1%
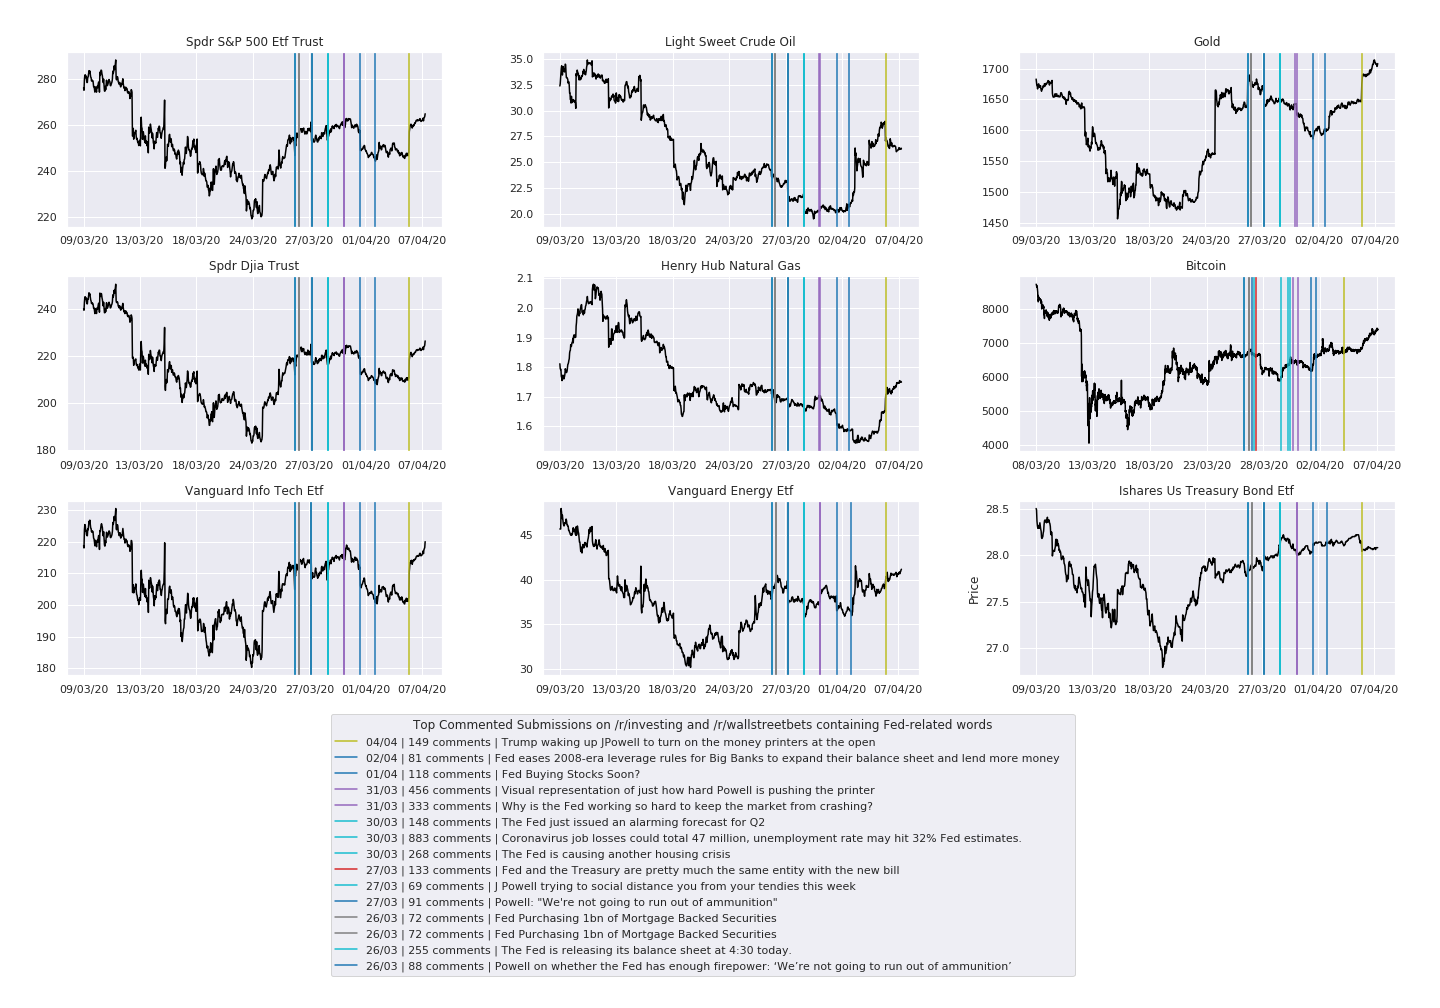
Part Two: the Freefall, and Oil
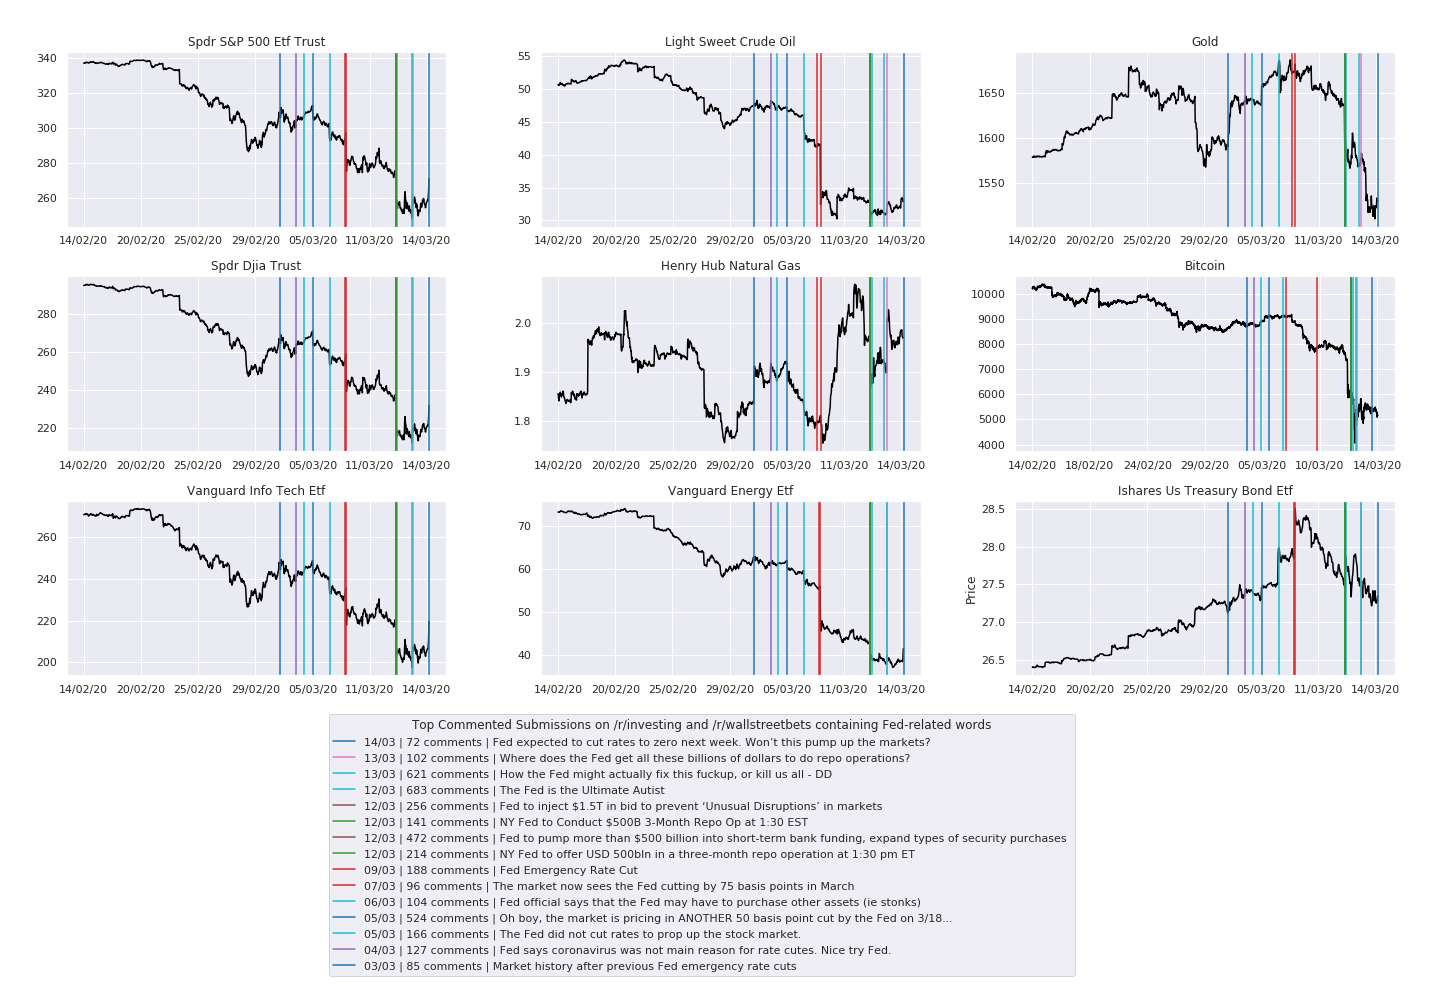
Pardon the language in some of these titles - /r/wallstreetbets isn't a particularly good place for civil dialogue
It comes as no surprise to see activity on forums massively rise after these unprecedented measures. On this next gap, posts between the 29th of February and 14th of March have completely overwhelmed the previous posts (as these posts are filtered by percentile within said timeframes).
- The Fed cuts rates on the 3rd of March, but that apparently was not enough. Officially, their reason was "not to prop up the stock market", though public posts expressed skepticism over this.
- Gold shot back up from 1580 to 1640 on the 3rd of March, in accordance with Fed rates.
- Perhaps some evidence of this is that the market priced in an additional 50 bps cut by the 5th of March, even though the S&P 500 hovered in the 300 range between the previous rate cut and the 5th.
- Of note is the news of the Saudi-Russia conflict regarding oil (CNBC article) on the 8th of March. Here we see Oil prices plummet, Natural Gas shoot up (oil as a leading indicator for NG?)
- It comes as no surprise that the Vanguard Energy ETF (VDE) plummets in tandem with oil prices, as they have substantial holdings in oil-related companies
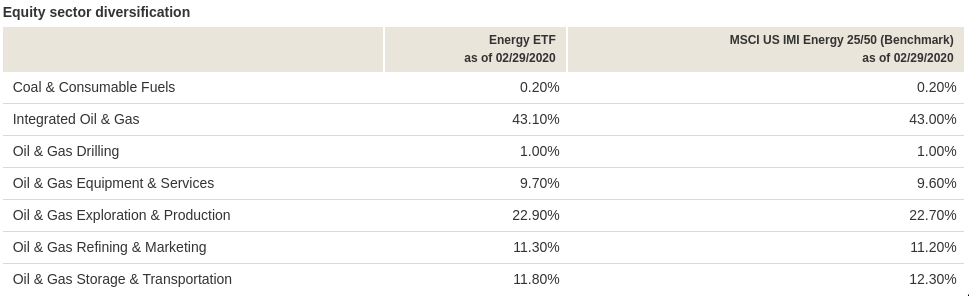
VDE holdings
- It comes as no surprise that the Vanguard Energy ETF (VDE) plummets in tandem with oil prices, as they have substantial holdings in oil-related companies
- Another emergency rate cut of 0.75bps comes in on the 9th of March, even larger than the 0.50 bps priced in on the 5th. This spooks the markets, causing the SPX to fall from 295-ish to 280. This fall comes in conjunction with the OPEC oil announcement in the above point.
- Along with this came the announcement of reducing banks' Fractional Reserve requirements to zero. Zero!!! This changes the nature of Repo operations, as the overnight repo markets as largely used by banks to maintain sufficient cash reserves to meet said requirements.
- Another short period of stability for markets - interestingly, between the 9th and the 13th Treasuries and Gold fell significantly
- Another circuit breaker day on the 12th following Fed announcements for massive repo operations and 8000 to $4000.
Part Three: the Bolsters and the Reaction
Sentiment over the Fed reaches extremes as Jay Powell announces unlimited stimulus
The public (especially /r/wallstreetbets) gets more and more frenzied; again, posts in this period completely overwhelm those in the previous two weeks in terms of comments. FOMO has kicked in at this point, with the SPX having fallen a massive 23.5% from highs of 340 to 260 as of the 17th of March.
- The Fed continues to offer overnight repo funding to provide liquidity for banks, with articles between the 16th of March and the 18th of March.
- Between this period and the 22nd, markets continue to trend down. Gold stabilizes, while Bitcoin rebounds and treasuries are confused.
- Disastrous jobless rate projections (this deserves a visualization on its own) and unlimited Quantitative Easing announced on the 22nd to 23rd of March.
- Following the announcement of unlimited QE, markets start to climb. Gold spikes from 1550 to 1650 - perhaps natural, given worries of inflation - while treasuries and Bitcoin stabilize. Crude futures stabilizes at $25/barrel.
- Of note: during this period sentiment was still hugely bearish. A majority of the popular posts I noticed included projections for Crude to fall to the 180, with very few mentions of rebounds apart from on /r/investing.
Part Four: the Stabilization
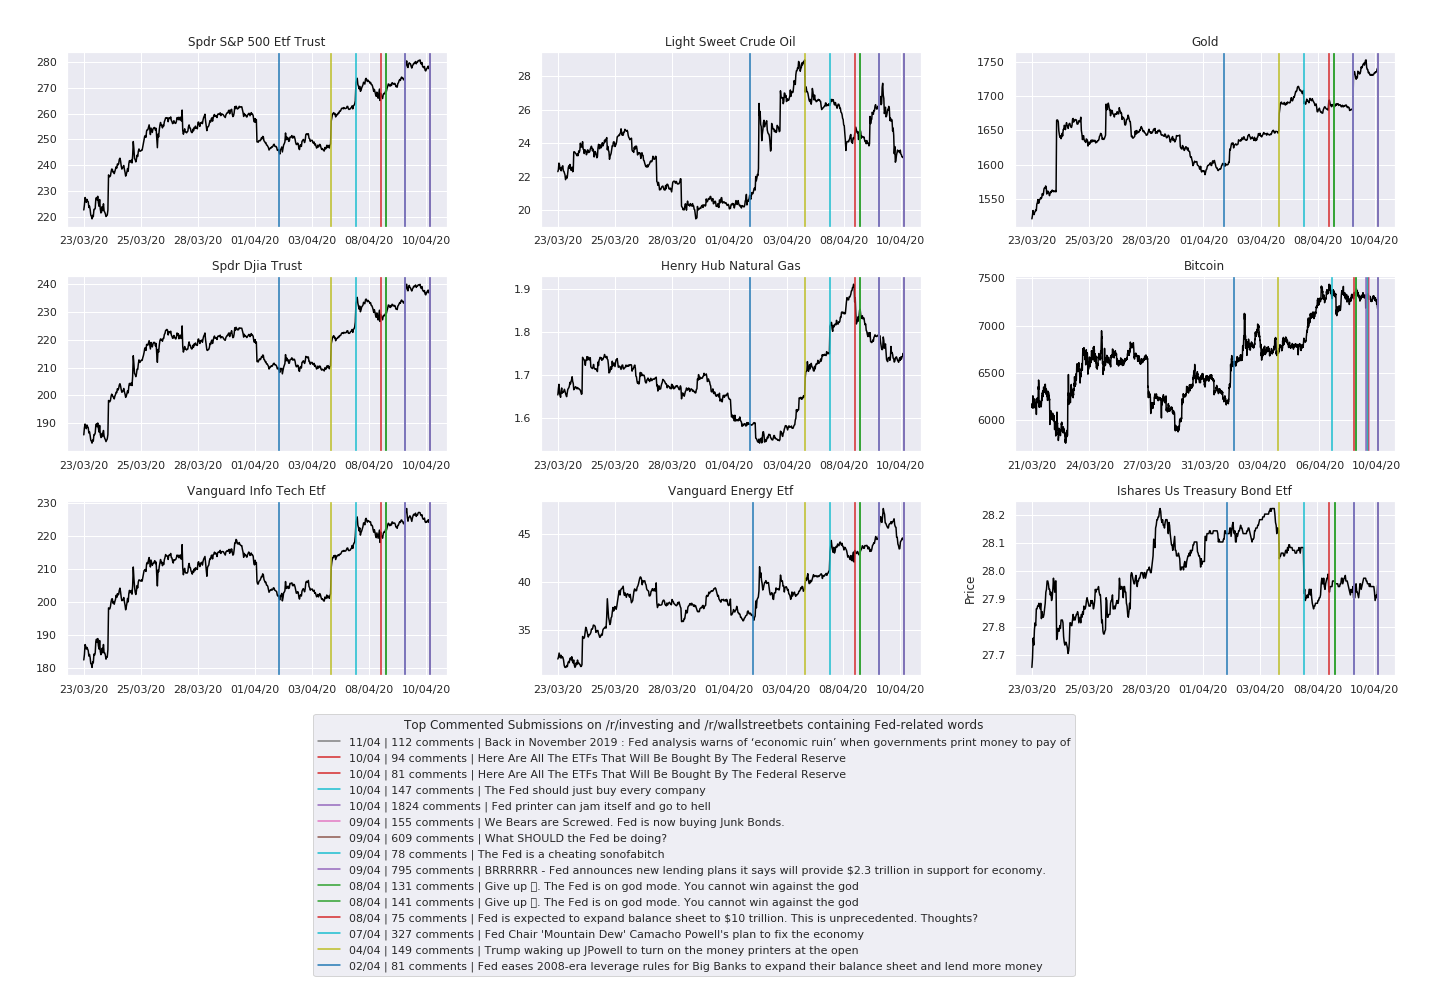
Following the 22nd, the Fed appears to have stabilized the markets. Wallstreetbets shorters complain about 'Fed printers going BRRRRRRR' while the Fed gradually provides details of implementation of its unlimited QE: purchasing ETFs, Mortgage Backed Securities, junk bonds, and the like, likely to prevent the disastrous effects of a cascading chain of defaults up the risk chain. The Fed "is expected to expand balance sheet to $10 trillion".